An Overview of the Cell Cycle
The primary function of the cell cycle is to accurately duplicate the large amount of DNA in chromosomes and then divide these copies precisely into two genetically identical daughter cells. This process defines the two main stages of the cell cycle. DNA duplication occurs during the S phase (S for synthesis), which takes about 10-12 hours and typically accounts for half of the cell cycle duration in a mammalian cell. After the S phase, chromosome segregation and cell division take place in the M phase (M for mitosis), which takes much less time—usually under an hour in a mammalian cell. The M phase involves dramatic events, starting with nuclear division, or mitosis. Mitosis begins with chromosome condensation: the replicated DNA, initially in the form of elongated chromosomes, condenses into compact structures necessary for their segregation. Next, the nuclear envelope breaks down, and the replicated chromosomes, each consisting of a pair of sister chromatids, attach to the microtubules of the mitotic spindle. As mitosis progresses, the cell pauses at metaphase, where the chromosomes align at the spindle’s equator, ready for segregation. The sudden separation of sister chromatids marks the beginning of anaphase, during which chromosomes are pulled toward opposite poles of the spindle, where they decondense and form intact nuclei. The cell then undergoes cytokinesis, where the cytoplasm divides, completing cell division.
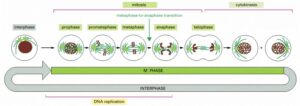
The processes of nuclear division (mitosis) and cell division (cytokinesis), collectively known as M phase, are typically only a small part of the cell cycle. The much longer phase, known as interphase, occupies the remainder of the cycle. The five stages of mitosis are illustrated, with a significant biochemical change occurring as the cell transitions from metaphase to anaphase. A cell can pause in metaphase before this transition, but once this point is passed, the cell proceeds through mitosis and cytokinesis into interphase. It is important to note that DNA replication occurs during interphase, specifically in the S phase (which is not shown in the illustration).
Most cells require much more time to grow and double their mass of proteins and organelles than to replicate their DNA and divide. To allow more time for growth, extra gap phases are included in most cell cycles—G1 phase between M phase and S phase, and G2 phase between S phase and mitosis. Thus, the eukaryotic cell cycle is traditionally divided into four sequential phases: G1, S, G2, and M (Figure 17-3). G1, S, and G2 together are referred to as interphase. In a typical human cell proliferating in culture, interphase might occupy 23 hours of a 24-hour cycle, with just 1 hour for M phase.
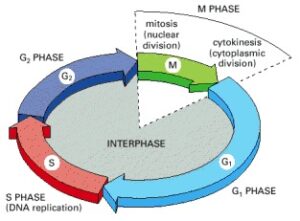
The cell grows continuously during interphase, which consists of three phases: DNA replication occurs exclusively in the S phase. G1 is the gap between M phase and S phase, while G2 is the gap between S phase and M phase. During M phase, the nucleus divides first, followed by the division of the cytoplasm.
The two gap phases serve more than just as simple time delays for cell growth. They also give the cell time to monitor both its internal and external environments to ensure that conditions are favorable and preparations are complete before it commits to the significant changes of the S phase and mitosis. The G1 phase, in particular, plays a crucial role in this process. Its length can vary significantly depending on external conditions and extracellular signals from other cells. For instance, when external conditions are unfavorable, cells may delay their progress through G1 and even enter a specialized resting state called G0 (G zero), where they can remain for days, weeks, or even years before reactivating proliferation. In fact, many cells stay permanently in G0 until the organism or the cell dies. When external conditions are favorable and signals promoting growth and division are present, cells in early G1 or G0 will pass through a commitment point near the end of G1, known as the “Start” in yeasts or the “restriction point” in mammalian cells. Once cells pass this point, they are committed to DNA replication, even if the extracellular signals that stimulate growth and division are no longer present.
The Cell-Cycle Control System Is Similar in All Eukaryotes
Some aspects of the cell cycle, such as the time required to complete specific events, can vary greatly between different cell types, even within the same organism. However, the basic structure of the cycle and its regulatory system is essentially identical in all eukaryotic cells. The proteins of this control system emerged more than a billion years ago.
Remarkably, these proteins have been so well conserved throughout evolution that many of them function perfectly when transferred from a human cell to a yeast cell. This allows researchers to study the cell cycle and its regulation across a variety of organisms and combine findings from all of them to build a unified understanding of how eukaryotic cells divide. In the following section, we briefly review the three eukaryotic systems commonly used to study cell-cycle control: yeasts, frog embryos, and cultured mammalian cells.
The Cell-Cycle Control System Can Be Dissected Genetically in Yeasts
Yeasts are small, single-celled fungi whose mechanisms of cell-cycle control are strikingly similar to our own. Two species are commonly used in cell cycle studies. The fission yeast Schizosaccharomyces pombe, named after the African beer for which it is used, is rod-shaped and grows by elongating at its ends. Division occurs by the formation of a septum, or cell plate, in the center of the rod (Figure 17-4A). The budding yeast Saccharomyces cerevisiae, used by brewers and bakers, is oval-shaped and divides by forming a bud that first appears during G1 and grows steadily until it separates from the mother cell after mitosis.
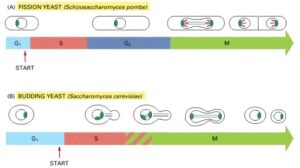
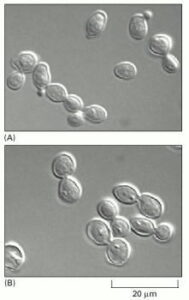
A Comparison of the Cell Cycles of Fission Yeasts and Budding Yeasts
(A) The fission yeast follows a typical eukaryotic cell cycle, including the G1, S, G2, and M phases. However, unlike higher eukaryotic cells, the nuclear envelope in the yeast cell does not break down during M phase. The microtubules of the mitotic spindle (light green) form within the nucleus and attach to spindle pole bodies (dark green) at the periphery of the nucleus. The cell divides by forming a partition, known as the cell plate, and then splits into two. The condensed mitotic chromosomes (red) are clearly visible in fission yeast, though they are harder to observe in budding yeasts.
(B) The budding yeast has normal G1 and S phases, but it lacks a typical G2 phase. Instead, a microtubule-based spindle begins to form inside the nucleus early in the cycle, during the S phase. Unlike fission yeast cells, budding yeast cells divide by budding. As with fission yeast, but unlike higher eukaryotic cells, the nuclear envelope remains intact during mitosis, and the spindle forms within the nucleus.
Despite their outward differences, the two yeast species share many useful features for genetic studies. They reproduce nearly as quickly as bacteria and have a genome size less than 1% that of a mammal. They are also amenable to rapid molecular genetic manipulation, allowing genes to be deleted, replaced, or modified. Most importantly, these yeasts have the unusual ability to proliferate in a haploid state, meaning only one copy of each gene exists in the cell. When cells are haploid, it becomes easier to isolate and study mutations that inactivate a gene, as there is no second copy of the gene complicating the study.
Many important discoveries about cell-cycle control have arisen from systematic searches for mutations in yeasts that disable genes encoding essential components of the cell-cycle control system. The genes affected by these mutations are called cell-division-cycle (cdc) genes. These mutations often cause cells to arrest at specific points in the cycle, suggesting that the normal gene product is necessary to allow progression past these checkpoints.
A mutant that cannot complete the cell cycle cannot proliferate. Therefore, cdc mutants can only be selected and maintained if their phenotype is conditional—that is, if the gene product fails to function only under certain conditions. Most conditional cell-cycle mutations are temperature-sensitive mutations, where the mutant protein fails to function at high temperatures but works sufficiently at low temperatures to permit cell division. A temperature-sensitive cdc mutant can be grown at a permissive low temperature and then shifted to a restrictive high temperature, turning off the function of the mutant gene. At the higher temperature, the cells continue through the cycle until they reach the point where the function of the mutant gene is needed for further progression, and at that point, they halt. In budding yeasts, this uniform arrest in the cell cycle can be observed simply by looking at the cells: the presence or absence of a bud, and its size, indicate the point in the cycle where the mutant is arrested.
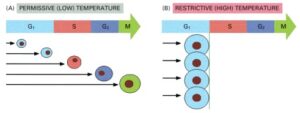
The behavior of a temperature-sensitive cdc mutant.
(A) At the permissive (low) temperature, the cells divide normally and are found in all phases of the cycle (the phase of the cell is indicated by its color).
(B) When warmed to the restrictive (high) temperature, at which the mutant gene product functions abnormally, the mutant cells continue to progress through the cycle until they reach the specific step they cannot complete (e.g., initiation of S phase in this example). Because the cdc mutants still continue to grow, they become abnormally large. In contrast, non-cdc mutants, if deficient in a process required throughout the cycle for biosynthesis and growth (like ATP production), halt at random points in the cycle, depending on when their biochemical reserves are depleted (not shown).
The morphology of budding yeast cells arrested by a cdc mutation.
(A) In a normal population of proliferating yeast cells, the size of the buds varies according to the cell-cycle stage.
(B) In a cdc15 mutant grown at the restrictive temperature, cells complete anaphase but cannot complete the exit from mitosis and cytokinesis. As a result, they arrest uniformly with large buds, which are characteristic of late M phase. (Courtesy of Jeff Ubersax.)
The Cell-Cycle Control System Can Be Analyzed Biochemically in Animal Embryos.
While yeasts are ideal for studying the genetics of the cell cycle, the biochemistry of the cycle is most easily analyzed in the giant fertilized eggs of many animals, which carry large stores of the proteins needed for cell division. For example, the egg of the frog Xenopus is over 1 mm in diameter and contains 100,000 times more cytoplasm than an average cell in the human body. Fertilization of the Xenopus egg triggers an astonishingly rapid sequence of cell divisions, called cleavage divisions, in which the single giant cell divides, without growing, to produce an embryo with thousands of smaller cells. In this process, almost the only macromolecules synthesized are DNA—needed to create the thousands of new nuclei—and a small amount of protein. After the first division, which takes about 90 minutes, the next 11 divisions occur more or less synchronously, at 30-minute intervals, resulting in about 4096 (2^12) cells within 7 hours. Each cycle is divided into S and M phases of approximately 15 minutes each, with no detectable G1 or G2 phases.
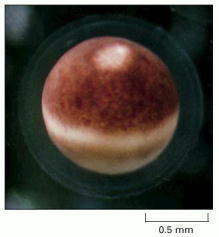
A mature Xenopus egg, ready for fertilization, shows a pale spot near the top where the nucleus is located. The nucleus has displaced the brown pigment in the surface layer of the egg cytoplasm. Although not visible in this image, the nuclear envelope has already broken down during the egg maturation process. (Courtesy of Tony Mills.)
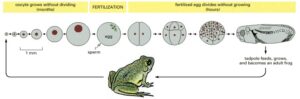
Oocyte Growth and Egg Cleavage in Xenopus:
The oocyte grows without dividing for several months in the ovary of the mother frog before maturing into an egg. After fertilization, the egg undergoes rapid cleavage, initially dividing every 30 minutes. This process forms a multicellular tadpole within a day or two. With each division, the cells become progressively smaller, but the overall size of the embryo remains constant. Growth only begins when the tadpole starts feeding. The drawings in the top row are to scale, though the frog depicted below is not.
The primary function of the cell cycle is to accurately duplicate the DNA in chromosomes and then segregate the copies into two genetically identical daughter cells. This process consists of two main phases. DNA replication takes place during S phase (S for synthesis), which lasts about 10–12 hours and accounts for roughly half of the cell cycle in a typical mammalian cell. After S phase, chromosome segregation and cell division happen during M phase (M for mitosis), which takes much less time (less than an hour in a mammalian cell). M phase involves dramatic events, beginning with mitosis, where the chromosomes condense. During this process, the duplicated DNA strands, initially in the form of extended chromosomes, condense into tightly packed chromosomes, which are required for their proper separation.
The nuclear envelope breaks down, and the duplicated chromosomes, each consisting of two sister chromatids, attach to microtubules of the mitotic spindle. As mitosis progresses, the cell briefly pauses in metaphase, where the chromosomes are aligned at the spindle’s equator, preparing for their segregation. The sudden separation of sister chromatids marks the start of anaphase, during which the chromosomes move toward opposite poles of the spindle, decondense, and re-form intact nuclei. Finally, the cell undergoes cytoplasmic division, or cytokinesis, and cell division is complete.
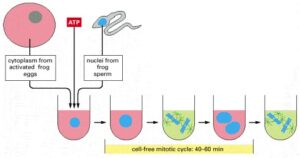
In studying the cell cycle in a cell-free system, a large batch of activated frog eggs is gently broken open through centrifugation, which also separates the cytoplasm from other cellular components. The undiluted cytoplasm is then collected, and sperm nuclei, along with ATP, are added. The sperm nuclei decondense and undergo repeated cycles of DNA replication and mitosis, which indicates that the cell-cycle control system is active within this cell-free cytoplasmic extract.
Studying the cell-cycle control system of mammals can be challenging since observing individual cells in an intact mammal is difficult. As a result, most studies on mammalian cell-cycle control use cells isolated from normal tissues or tumors, which are then cultured in plastic dishes with essential nutrients and factors. However, there is a complication: when cells from normal mammalian tissues are cultured under standard conditions, they often stop dividing after a certain number of division cycles. For instance, human fibroblasts cease dividing permanently after 25-40 divisions, a process known as replicative cell senescence, which will be discussed later.
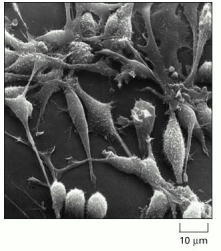
This scanning electron micrograph shows rat fibroblasts that are proliferating in culture. (Courtesy of Guenter Albrecht-Buehler.)
Mammalian cells can occasionally undergo mutations that enable them to proliferate rapidly and indefinitely in culture, becoming “immortalized” cell lines. While these cells are not normal, they are widely used for cell-cycle studies and in cell biology in general due to their ability to provide an unlimited supply of genetically homogeneous cells. These cells are large enough to allow detailed cytological observation of cell-cycle events, and they are amenable to biochemical analysis of the proteins involved in cell-cycle control.
Studies of cultured mammalian cells have been especially useful in examining the molecular mechanisms that control cell proliferation in multicellular organisms. These studies are essential not only for understanding the normal regulation of cell numbers in tissues but also for understanding the loss of these controls in cancer (discussed in Chapter 23).
Cell-Cycle Progression Can Be Studied in Various Ways
How can we determine the stage of an animal cell in the cell cycle? One way is to observe living cells under a microscope. By looking at a population of mammalian cells growing in culture, one can see that some cells have rounded up and are in mitosis, while others are undergoing cytokinesis. However, cells in S phase cannot be detected just by visual inspection. They can be identified by adding visualizable molecules, like 3H-thymidine or the synthetic thymidine analog bromo-deoxyuridine (BrdU), which are incorporated into newly synthesized DNA. Cells that have incorporated 3H-thymidine can be visualized by autoradiography, whereas those that have incorporated BrdU are identified by staining with anti-BrdU antibodies.
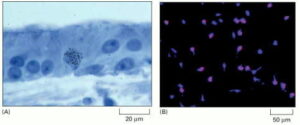
Labeling S-Phase Cells
(A) The tissue has been exposed briefly to 3H-thymidine, and the labeled cells have been visualized through autoradiography. The silver grains (black dots) in the photographic emulsion above a nucleus indicate that the cell incorporated 3H-thymidine into its DNA, suggesting that it was in S phase at some point during the labeling period. In this specimen, which shows the sensory epithelium from the inner ear of a chicken, the presence of an S-phase cell indicates that cell proliferation is occurring in response to damage.
(B) An immunofluorescence micrograph of BrdU-labeled glial precursor cells in culture. The cells were exposed to BrdU for 4 hours, then fixed and labeled with fluorescent anti-BrdU antibodies (red). All the cells are stained with a blue fluorescent dye.
Typically, in a population of cells that are all proliferating rapidly but asynchronously, about 30–40% will be in S phase at any given moment and will become labeled by a brief pulse of 3H-thymidine or BrdU. From the proportion of cells in such a population that are labeled (the labeling index), one can estimate the duration of S phase as a fraction of the entire cell cycle. Similarly, by measuring the proportion of these cells in mitosis (the mitotic index), the duration of M phase can also be estimated. Furthermore, by giving a pulse of 3H-thymidine or BrdU and allowing the cells to continue through the cycle for measured periods of time, one can determine how long it takes for an S-phase cell to progress through G2 into M phase, from M phase into G1, and finally from G1 back into S phase.
Another method for determining which stage a cell is in the cell cycle is by measuring its DNA content, which doubles during S phase. This process is greatly aided by the use of DNA-binding fluorescent dyes and a flow cytometer, which allows large numbers of cells to be analyzed rapidly and automatically .Flow cytometry can also be used to determine the lengths of G1, S, and G2 + M phases by tracking over time a population of cells that has been preselected to be in a particular phase of the cell cycle. DNA content measurements from such a synchronized population of cells show how the cells progress through the cycle.
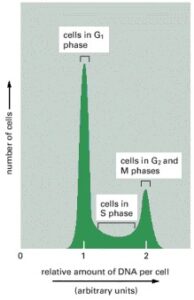
Analysis of DNA Content Using a Flow Cytometer:
This graph displays typical results obtained for a proliferating cell population when the DNA content of its individual cells is measured using a flow cytometer. A flow cytometer, also known as a fluorescence-activated cell sorter (FACS), can also be used to sort cells based on their fluorescence .The cells analyzed here were stained with a dye that fluoresces when it binds to DNA, so the level of fluorescence is directly proportional to the amount of DNA in each cell.The cells fall into three categories: those with an unreplicated DNA complement, indicating they are in G1 phase, those with a fully replicated DNA complement (twice the G1 DNA content), indicating they are in G2 or M phase, and those with an intermediate amount of DNA, indicating they are in S phase. The distribution of cells in this example shows that there are more cells in G1 phase than in G2 + M phase, suggesting that G1 is longer than G2 + M in this population.
Summary
Cell reproduction begins with the duplication of the cell’s contents, followed by the distribution of those contents into two daughter cells. Chromosome duplication takes place during the S phase of the cell cycle, while most other cellular components are continuously duplicated throughout the cycle. During the M phase, the replicated chromosomes are segregated into individual nuclei (mitosis), and the cell then divides into two (cytokinesis). S and M phases are usually separated by gap phases, called G1 and G2, during which cell-cycle progression is regulated by various intracellular and extracellular signals. The organization and control of the cell cycle have been highly conserved throughout evolution, and studies across a wide range of systems—including yeasts, frog embryos, and cultured mammalian cells—have led to a unified understanding of eukaryotic cell-cycle control.